This page reports the preliminary results from the WIRO monitoring campaign during the
1999 apparition of Io.
(See also the 1998 and January and February 1999 WIRO observations
during the "1998" Loki brightening.)
The main results so far are:
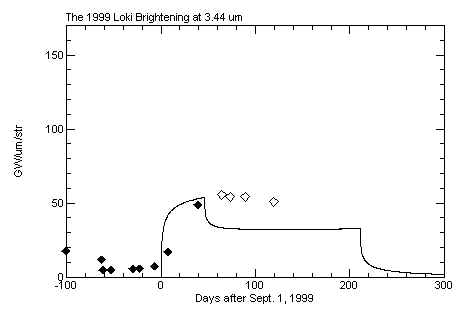
A) The detection and detailed history of another Loki brightening which began in early September and has continued through the end of the year. The 3.44 um flux from Loki has been remarkably stable during much of this brightening, as shown in a following plot.
B) The detection of a major outburst on August 2 -- corresponding to a source of approximately 1000K with a diameter of approximately 26 km. This is one of the few outbursts for which we have a good location. Galileo observations of this region will finally allow us to determine the types of features on Io which are the sites of this extreme activity. The outburst may also be related to the enhanced radiation experienced by Galileo on its perijove passage during the second week of August.
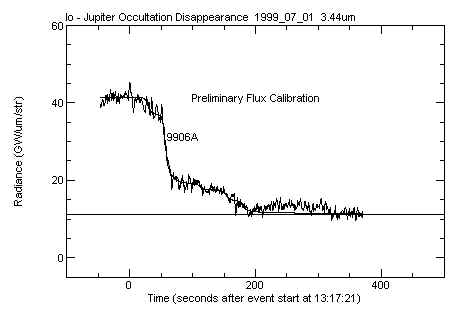
C) Observations on June 29 and July 1, designed to coincide with the Galileo C21 encounter, showed that the 9906A eruption, detected originally by John Spencer on June 22, was still active. The source had faded considerably from John's June 22 values but still dominated the activity on Io. WIRO observations from July 10 confirmed John's July 8 observations, showing the source had continued to fade to the point where by that date it was only slightly brighter than the other (relatively faint) sources on the disk.
Here is a plot giving preliminary values for the flux from Loki during the 1999 brightening. The solid symbols are from in-eclipse occultation disappearances (before opposition) while the open ones are from in-eclipse occultation reappearances (after opposition). The data have been corrected to "vertical emission" assuming a simple cosine dependence on emission angle. The increase between the last disappearance and first reappearance points may be real, but could also be due to a deviation from the assumed cosine law. Since opposition the flux from Loki has been remarkably stable.
The model shown with the data is not a fit to the 1999 brightening but rather to the 1998 one, to allow comparison of the two. The 1999 brightening does not show the turn-on transient evident in 1998, but the flux level is remarkably similar to the initial 1998 value.
The 1998 brightening was both slightly longer and on average slightly lower intensity than typical. It will be interesting to see if the higher level of activity in 1999 is accompanied by a shorter duration -- which might suggest that the brightenings are characterized by a fixed eruption volume.
The following is a table of preliminary in-eclipse/out-of-eclipse flux ratios. The points marked with an asterisk are somewhat suspect. The flux ratio r can be converted to an in-eclipse flux given in gigawatts/um/str by multiplying the sunlight-only flux in the first row by the quantity [1/(1/r-1)] which equals r for r << 1.
One set of eclipse ratios from mid-1998 during the Loki brightening are shown for comparison.
The data through 1999_10_10 are eclipse disappearances while those on and after 1999_11_04 are reappearances. The values drop somewhat at this transition, because Loki is closer to the limb on reappearance.
| Date | 2.2 um | 2.38 um | 3.44 um | 3.8 um | 4.7 um |
|---|---|---|---|---|---|
| sunlight-only GW | 7534 | 5565 | 1342 | 728 | 407 |
| 1998_07_21 | 0.0016 | 0.028 | 0.077 | 0.24 | |
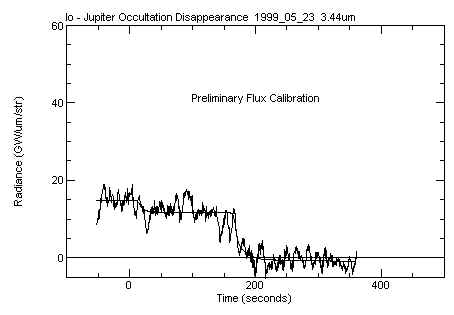
| 1999_05_23 | < 0.0003 (1 stdv) | 0.011 ± 0.001 | 0.012 ± 0.003* | 0.14 ± 0.01 | |
| 1999_06_29 | 0.006 ± 0.002 | 0.030 ± 0.005 | 0.17 ± 0.02 | ||
| 1999_07_01 | 0.00360 ± 0.00020 | 0.0043 ± 0.0003 | 0.025 ± 0.002 | 0.054 ± 0.003 | 0.155 ± 0.015 |
| 1999_07_10 | 0.0014 ± 0.0003 | 0.011 ± 0.002 | 0.028 ±0.003 | 0.123 ± 0.015 | |
| 1999_09_08 | 0.00096 ± 0.00004 | 0.0012 ± 0.0006 | 0.017 ± 0.001 | 0.047 ± 0.002 | 0.159 ± 0.007 |
| 1999_10_10 | 0.0018 ± 0.0001 | 0.030 ± 0.001 | 0.081 ± 0.016 | 0.221 ± 0.006 | |
| 1999_11_04 | 0.0016 ± 0.0001 | 0.024 ± 0.001 | 0.196 ± 0.020 | ||
| 1999_11_13 | 0.0014 ± 0.0001 | 0.021 ± 0.001 | 0.063 ± 0.0066 | 0.193 ± 0.004 | |
| 1999_12_29 | 0.00130 ± 0.00010 | 0.0015 ± 0.0001 | 0.022 ± 0.001 | 0.062 ± 0.002 | 0.211 ± 0.004 |
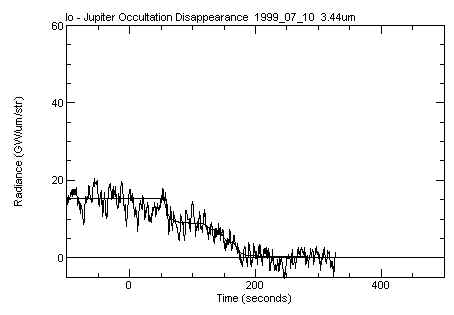
The following in-eclipse occultation disappearance curve was obtained:
The main drop occurs at 170.4 seconds after the nominal event start. This is a little early to be Loki and suggests that this source is somewhat west on Io from Loki. However the discrepancy is small enough that Loki cannot be excluded as the main source until data are obtained under better conditions. The following plot shows the nominal position of the Jupiter limb at that 170.4 second time.
The following occultation plot was obtained. Spencer's source 9906A clearly dominates with a flux of approximately 22.5 GW/um/str.
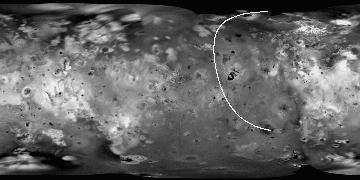
The following map shows the location of the Jupiter limb for the modeled 1999_07_01 sources. The first is presumably Kanehekili (marked by the square) while the second is consistent with Spencer's position for 9906A, marked by the cross. The last of the late-event sources is marginally consistent with Loki, given uncertainties in the fit and the ephemeris. Clearly Loki is relatively faint, if present at all.

The July 8 event at WIRO was lost to clouds, but John Spencer at IRTF reported that 9906A had faded to about 5 GW/um/str.
The event was observed at relatively high airmass (Io in eclipse as it rose through 3.5 airmasses) but the above eclipse ratios and following occultation plot were obtained. Consistent with John Spencer's observations from the July 8th, 9906A has faded considerably. The model flux in the following curve is 6.75 GW/um/str but approximately half could be assigned to Kanehekili or earlier sources.
Eclipse and occultation observations showed a relatively inactive Io. The data will be posted shortly.
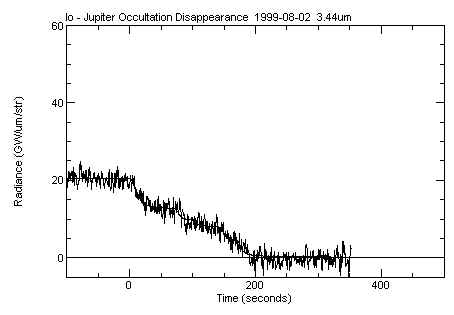
Observations of Io showed that a major outburst was underway. The following lightcurves were obtained at 4.7, 3.44, and 2.38 microns. At the longer wavelength by 16:20 UT the flux had increased to 3 times its normal in-sunlight value. When the data are modeled assuming a simple cosine dependence on emission angle then "vertical" hotspot fluxes of 1400, 2000 and 2200 GW/um/str are obtained for the three wavelengths. (A near equatorial location at longitude 71 W is assumed, as described below.) A fit to a simple Planck function indicates a source temperature of approximately 1000K and a diameter of approximately 26 km.
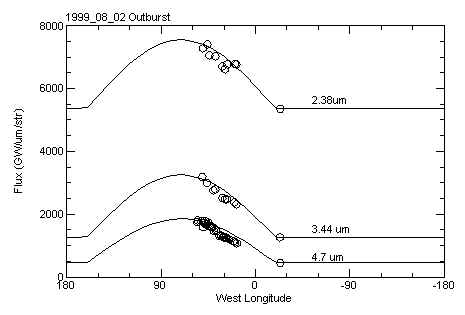
The 4.7 and 3.44 micron observations suggest that the source is growing brighter slightly faster than expected from the cosine law. (Time increases from right to left in the above plot). Either the source is intrinsically brightening or the cosine law underestimates the fall off with emission angle.
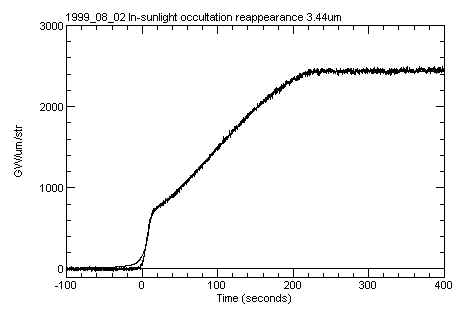
The source is clearly evident in the in-sunlight occultation reappearance. The midpoint time for the hotspot reappearance is 12:07:13.7 UT and it contributes 0.237 of the total flux. (A model is also plotted in this figure but is almost invisible behind the data except for a minor discrepancy just before hot spot reappearance. That discrepancy results from the simple Baum-Code treatment of the hot spot occultation.)
By fitting the disk reappearance as well as the hot spot one can eliminate ephemeris uncertainties in the limb arc which determines the location of the hotspot. The hot spot reappears 16.7 seconds after the beginning of the disk reappearance. Allowing a +/- 5 second error in the relative timing of the fits one obtains the following location for the hot spot. It must lie between the projected Jupiter limb locations at those +/- 5 second times, represented by the two almost parallel white arcs.
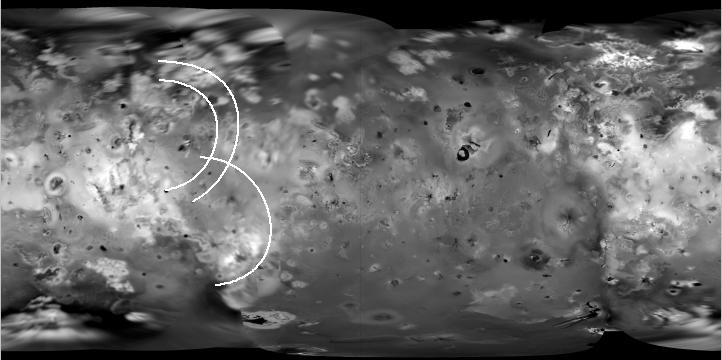
The centerline runs through the following positions. With foreshortening the +/- 5 second time error corresponds to a +/- 5 degree longitude error.
( -10.0, 96.9W )
( -5.6, 84.1W )
( -1.7, 78.7W )
( 2.1, 75.0W )
( 5.9, 72.3W )
( 9.6, 70.1W )
( 13.4, 68.5W )
( 17.2, 67.3W )
( 21.0, 66.4W )
( 25.0, 66.0W )
( 29.0, 66.1W )
( 33.1, 66.7W )
( 37.4, 68.0W )
( 41.9, 70.4W )
( 46.6, 74.7W )
( 51.5, 83.2W )
( 54.7,101.6W )
The outburst source was also evident in the earlier occultation disappearance, vanishing at 09:57:12.3 UT shortly after the start of the event. (See the following plot and the later 1999_08_09 curve for comparison.) It is much fainter in the disappearance because of the large emission angle and also perhaps because it was still growing with time. The disappearance time allows one to plot another limb arc on Io, represented by the curve almost perpendicular to the parallel pair in the above map. The lack of a sunlit disk means one remains sensitive to ephemeris errors. If however one ignores those possible errors one obtains a position for the outburst at (+9, 71W). The errors are probably less than five degrees.
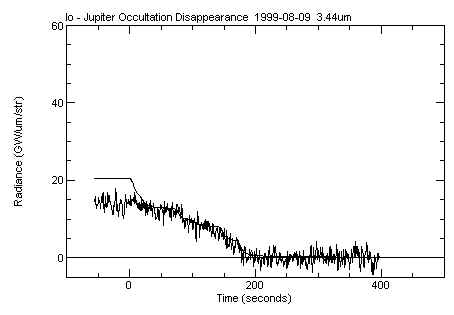
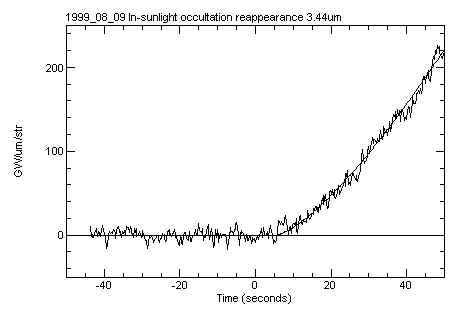
1999_08_09
The 9908A outburst has faded to an undetectable level at 3.44 microns. The disappearance, plotted below but with the 99_08_02 model shown for comparison, shows no sign of the source.
The expanded portion of the reappearance lightcurve, although affected somewhat by cirrus, shows no source brighter than 15 GW/um/str. The outburst source has faded by at least a factor of 30 since the 99_08_02 reappearance
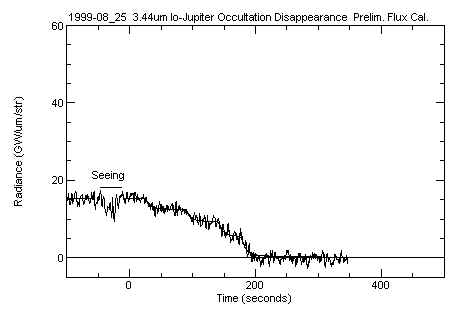
1999_08_25
The in-eclipse occultation disappearance lightcurve is essentially identical to that above, indicating that the Loki brightening seen for the first time on 1999_09_08 has not begun yet.
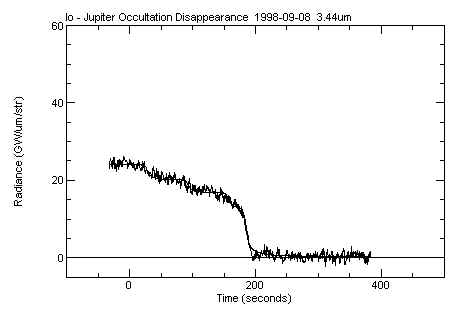
1999_09_08
A hotspot with a disappearance time consistent with Loki is turning on in the following occultation disappearance curve.
1999_09_16 through 1999_10_09
A variety of photometry and occultation observations were obtained, including 10 micron occultations from IRTF. Loki was clearly the dominant source in those 10 micron observations. The results will be posted here after preliminary processing is complete.
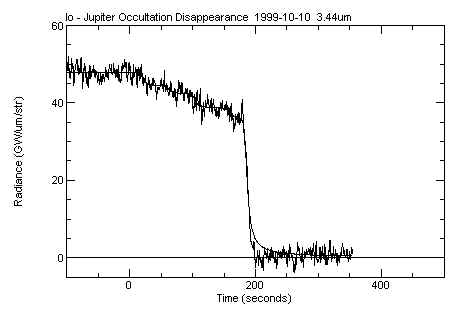
1999_10_10
The following occultation curve, obtained 24 hours before the Galileo I24 flyby, shows that the Loki brightening continues. The eclipse photometry presented in the table at the top of the page shows that the 3.8 and 4.7 micron flux also continues to increase. Kanehekili continues to be active, as well as a source which disappears approximately 15 seconds before Loki. The remainder of the flux comes from sources too faint to resolve.
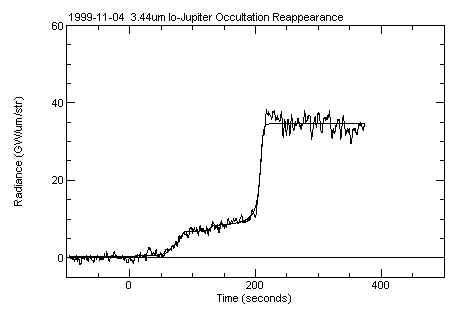
1999_11_04
After Jupiter opposition we obtain in-eclipse occultation reappearance curves rather than disappearance ones. The following one was obtained on November 04. Loki is clearly still active. Although it appears slightly fainter in this plot than in the above one, that is due to the fact the the reappearances occur with Loki closer to the limb. When the brightnesses are corrected to the value they would have for vertical viewing, Loki is actually slightly brighter on this date.
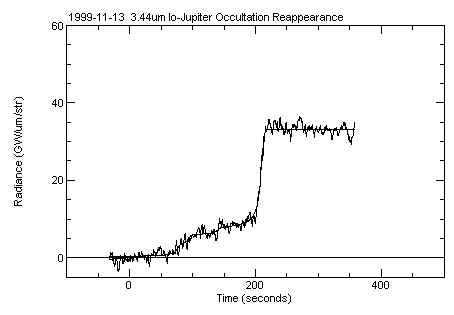
1999_11_13
An in-eclipse occultation reappearance curve essentially identical to that from 1999_11_04 was obtain. Loki remains active at a level which (within current calibration error of a few percent) is identical to that on November 4.
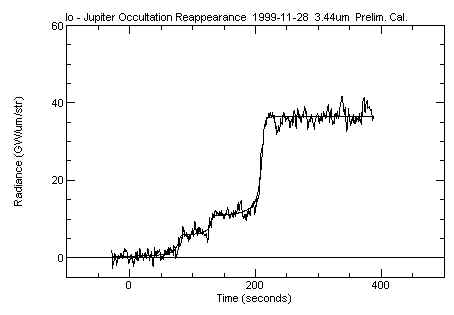
1999_11_28 (23:51 UT)
The in-eclipse occultation reappearance curve, obtained 3 days after the Galileo I25 encounter, shows that within calibration error (5%) Loki has remain constant since 1999_11_04. A source near 128 seconds, marginally evident in previous curves, reaches a flux level of 4.9 GW/um/str.
1999_12_29
The in-eclipse occultation reappearance curve shows that Loki is still active (as also seen by John Spencer in observations this night from the IRTF). When corrected to vertical emission the Loki flux is down approximately 6% from the very constant level it has maintained since early November. However that 6% is only slightly larger than the nominal error of the calibration. The Loki short wavelength activity has been remarkably stable over the past two months.
The occultation curve also appears to show a new source reappearing at 1:35:49, just 17 seconds after the reappearance begins and therefore very close to the limb. The observed flux (i.e. before applying a potentially large vertical correction factor) is 1.92 GW/um/str.
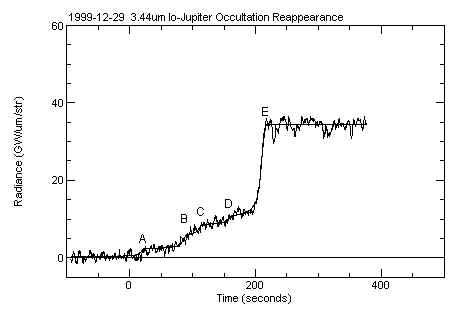
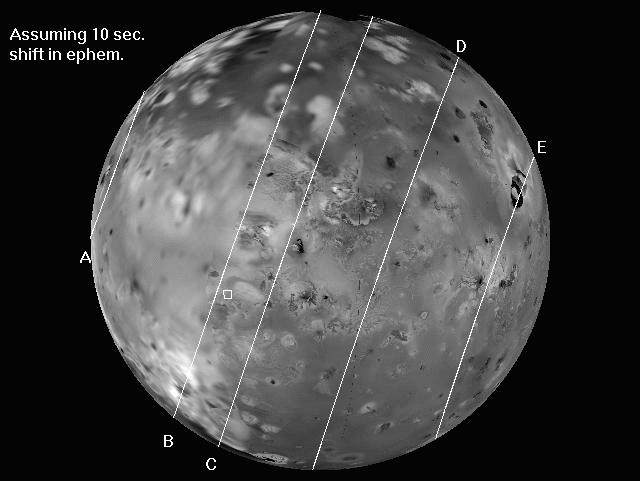
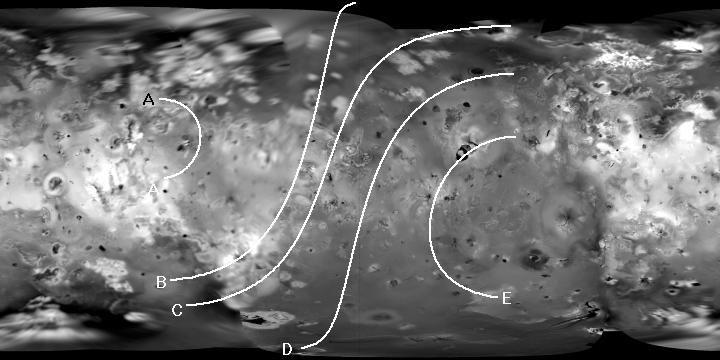
Possible locations of the sources are shown in the following maps. Only E (Loki) and perhaps "A" are isolated enough to have good locations. The three middle sources (B,C,D) are only partially resolved and the flux assigned to each is somewhat arbitrary. Some combination of source B and C is probably Kanehekili, marked by the small square on the globe. Note that in producing these limb plots I have used the "known" location of the Loki brightening to correct the somewhat uncertain ephemeris by 10 seconds.
Links to:
This page was last modified 04/02/02